Case studies
Real-world flood analyses built with euroflood, reproduced from the EuroFlood
paper. Where the tutorials teach one feature at a time on a
single place, these case studies combine the whole workflow (discover → attribute →
download → measure → compare against modelled hazard) on genuine events across Europe,
and are honest about what satellite detection can and cannot see.
-
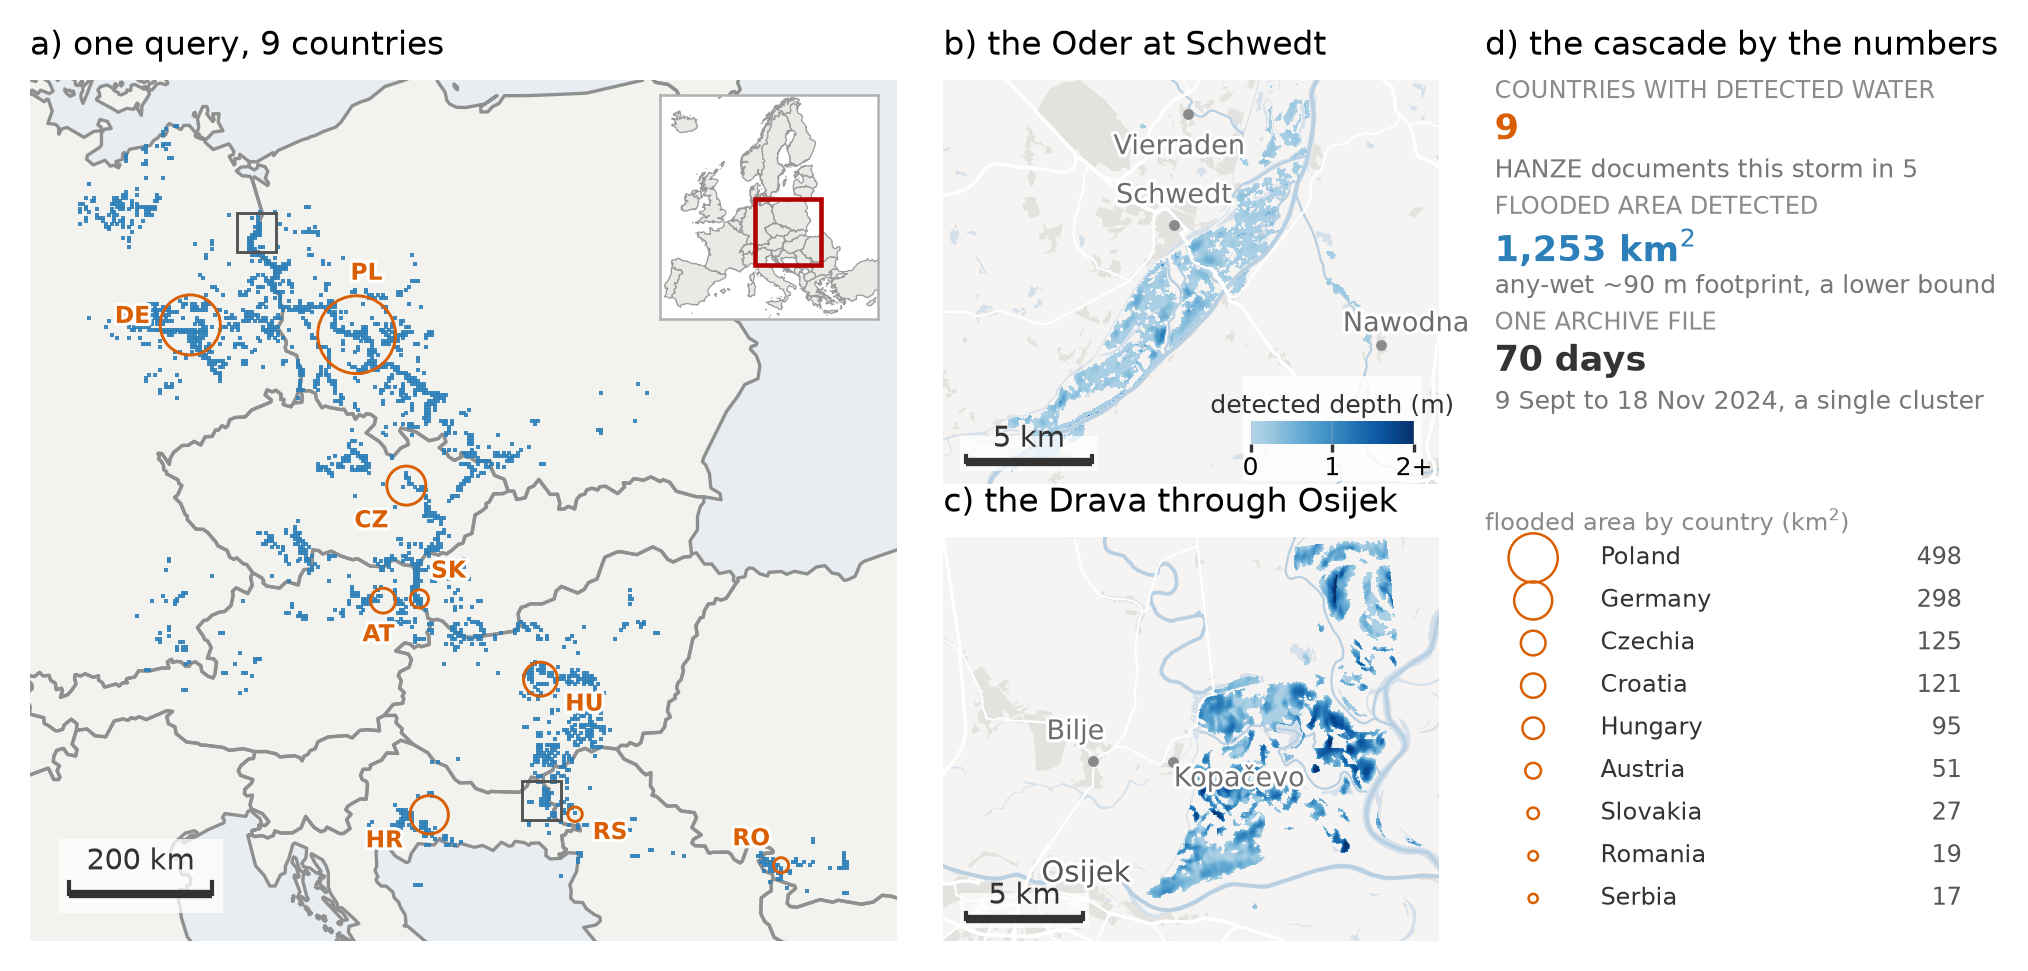
Storm Boris: a transboundary flood
One query resolves a 70-day, nine-country cluster (Sept 2024); per-country NUTS-0 attribution and observed depth on the Oder and Drava.
-
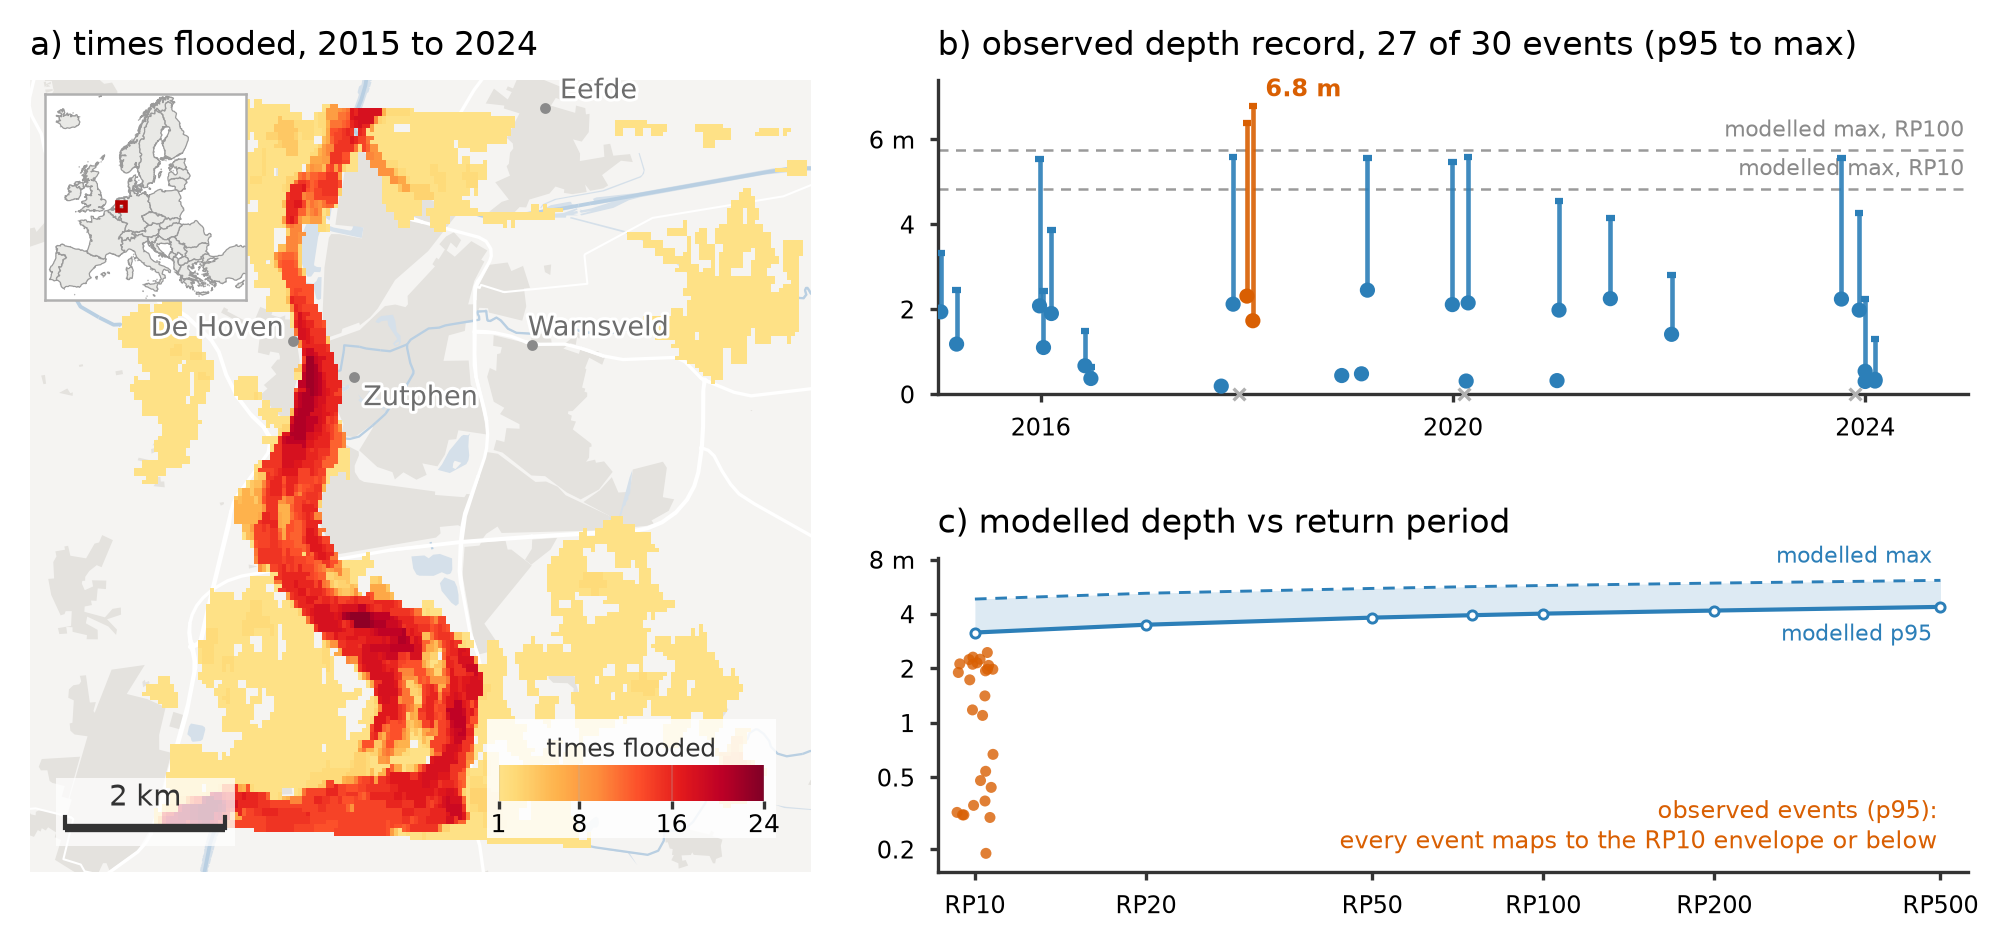
Ten years of flooding on the IJssel: per-cell recurrence, per-event depth, and observed depths placed against modelled GLOFAS return periods.
-
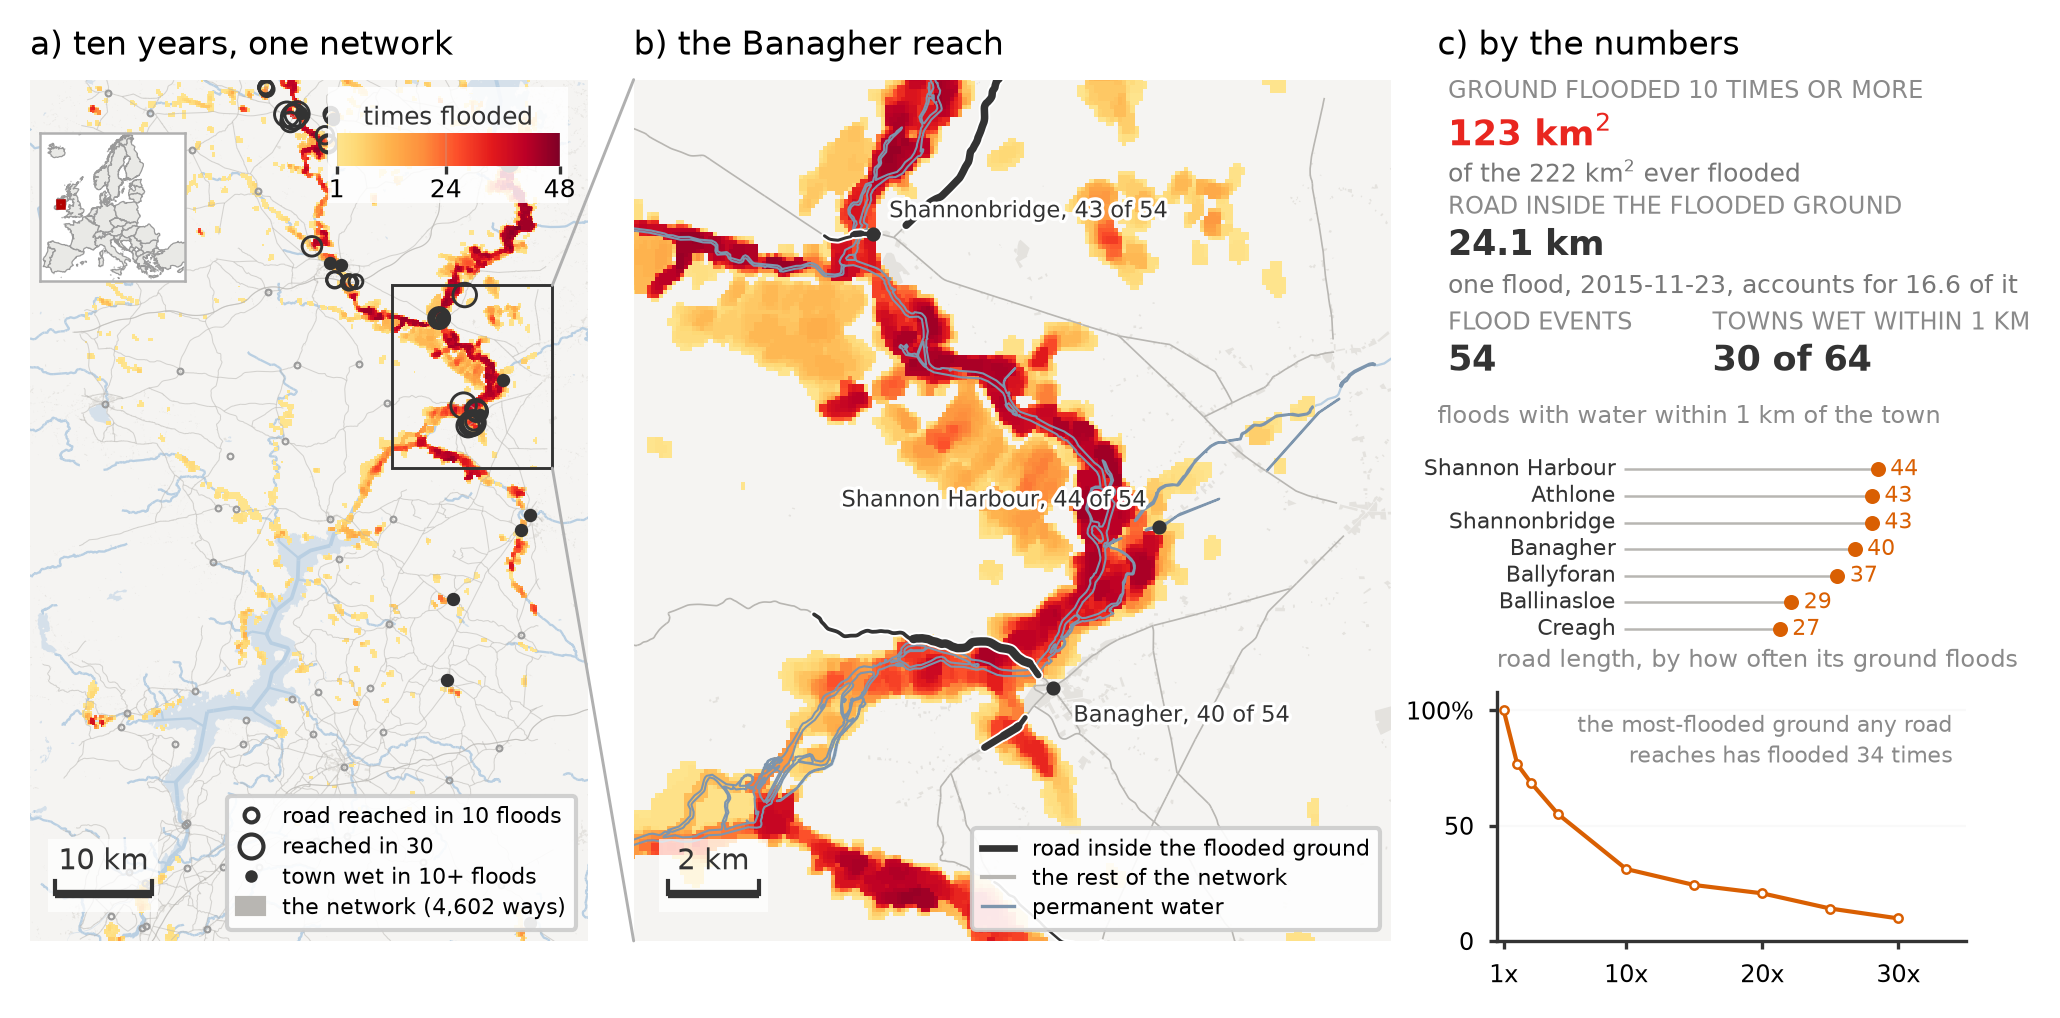
Shannon callows: infrastructure screening
Recurrence over the Irish midlands intersected with the OSM road and settlement network to estimate exposed infrastructure.
-
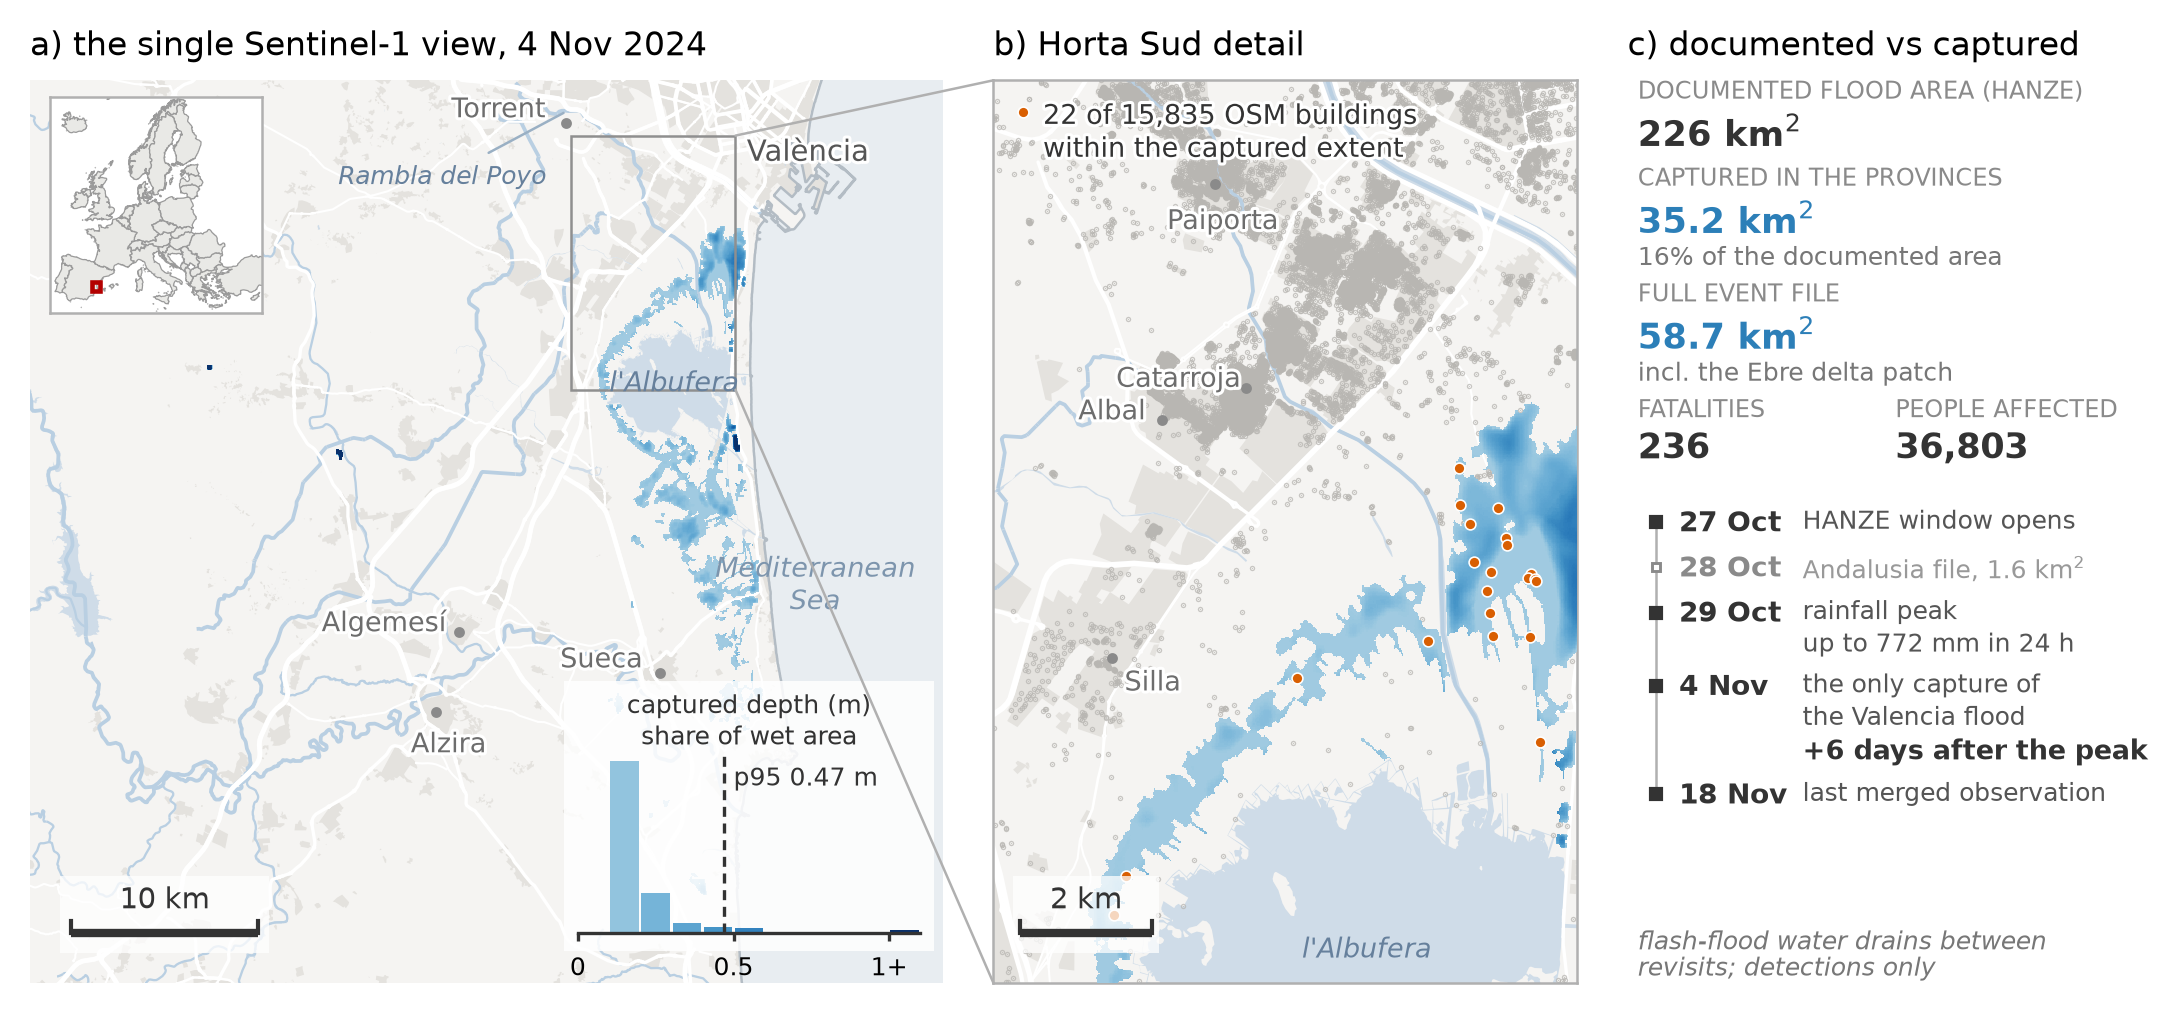
Valencia DANA: a detectability limit
A rapid-onset event (Oct 2024) where a single, delayed Sentinel-1 pass captures only ~16% of the documented flooded area, a worked example of what the archive misses.
-
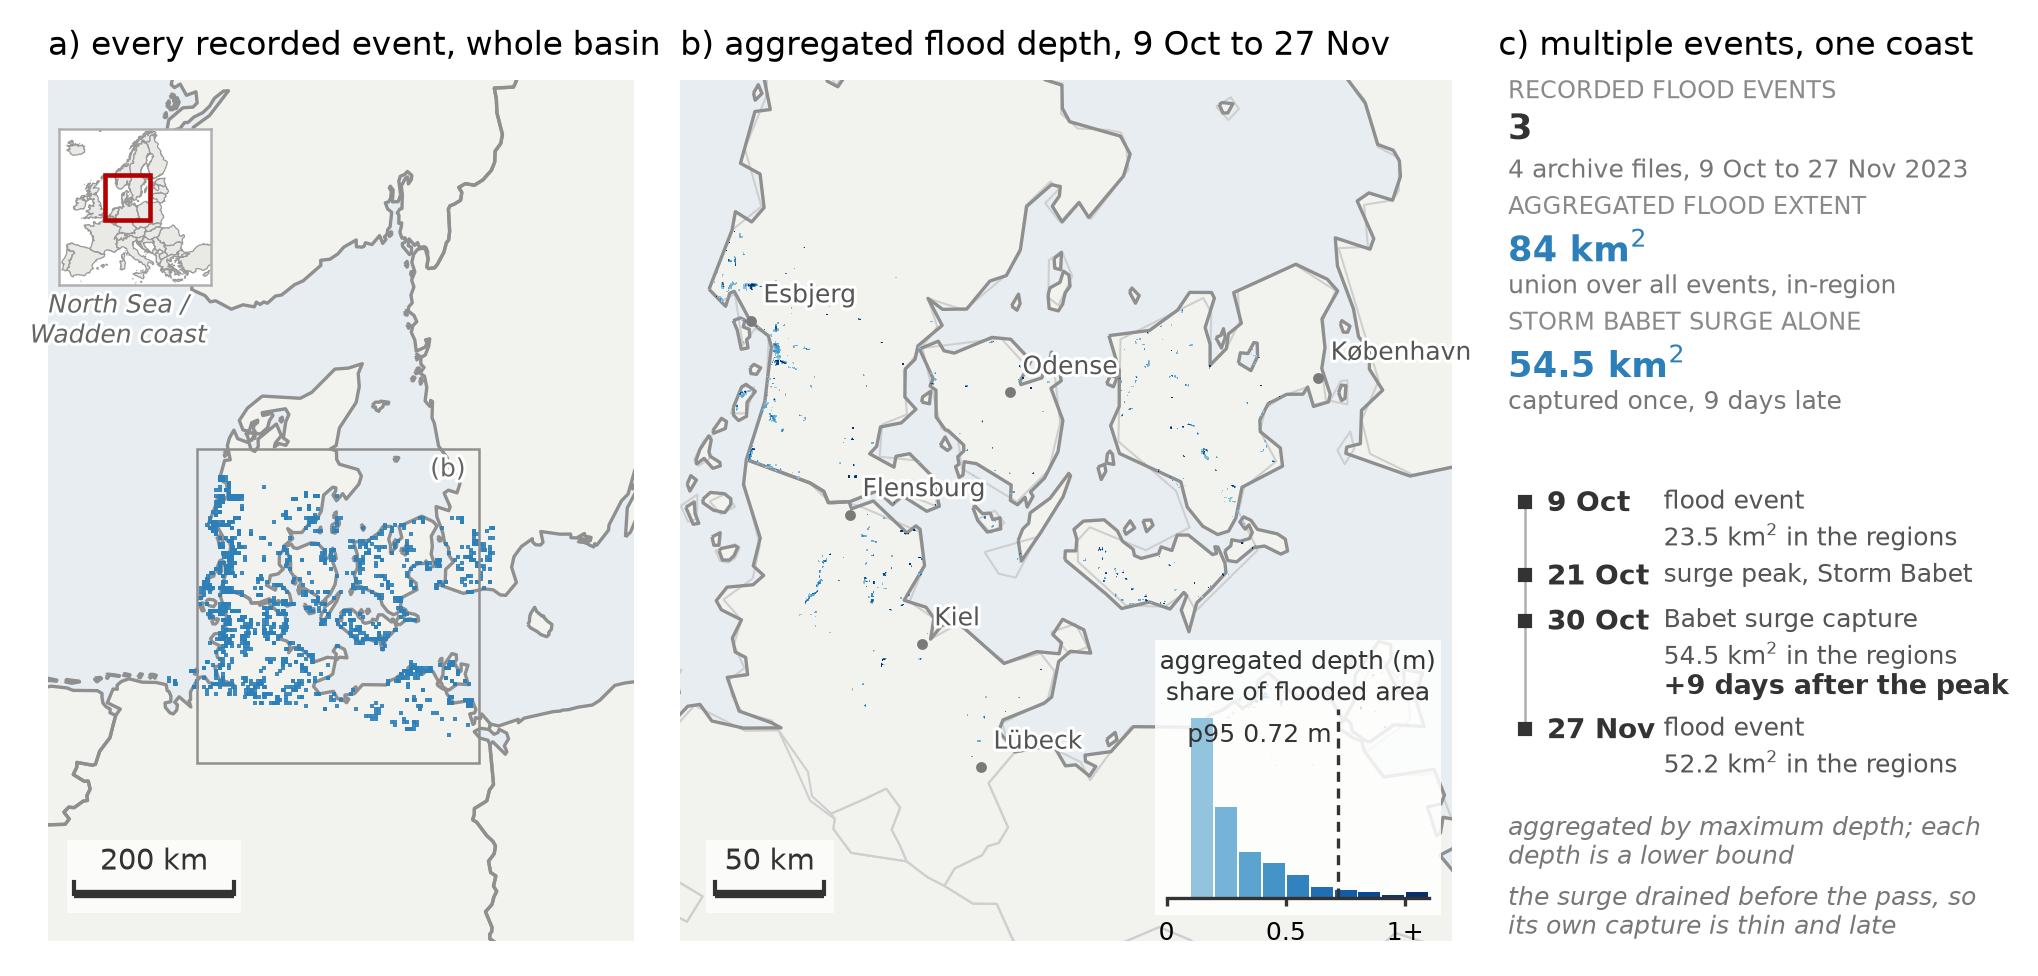
Baltic storm surge: coastal detectability
Storm Babet (Oct 2023): residual coastal inundation captured nine days after the peak, illustrating the limits of a fluvial-oriented archive at the coast.
-
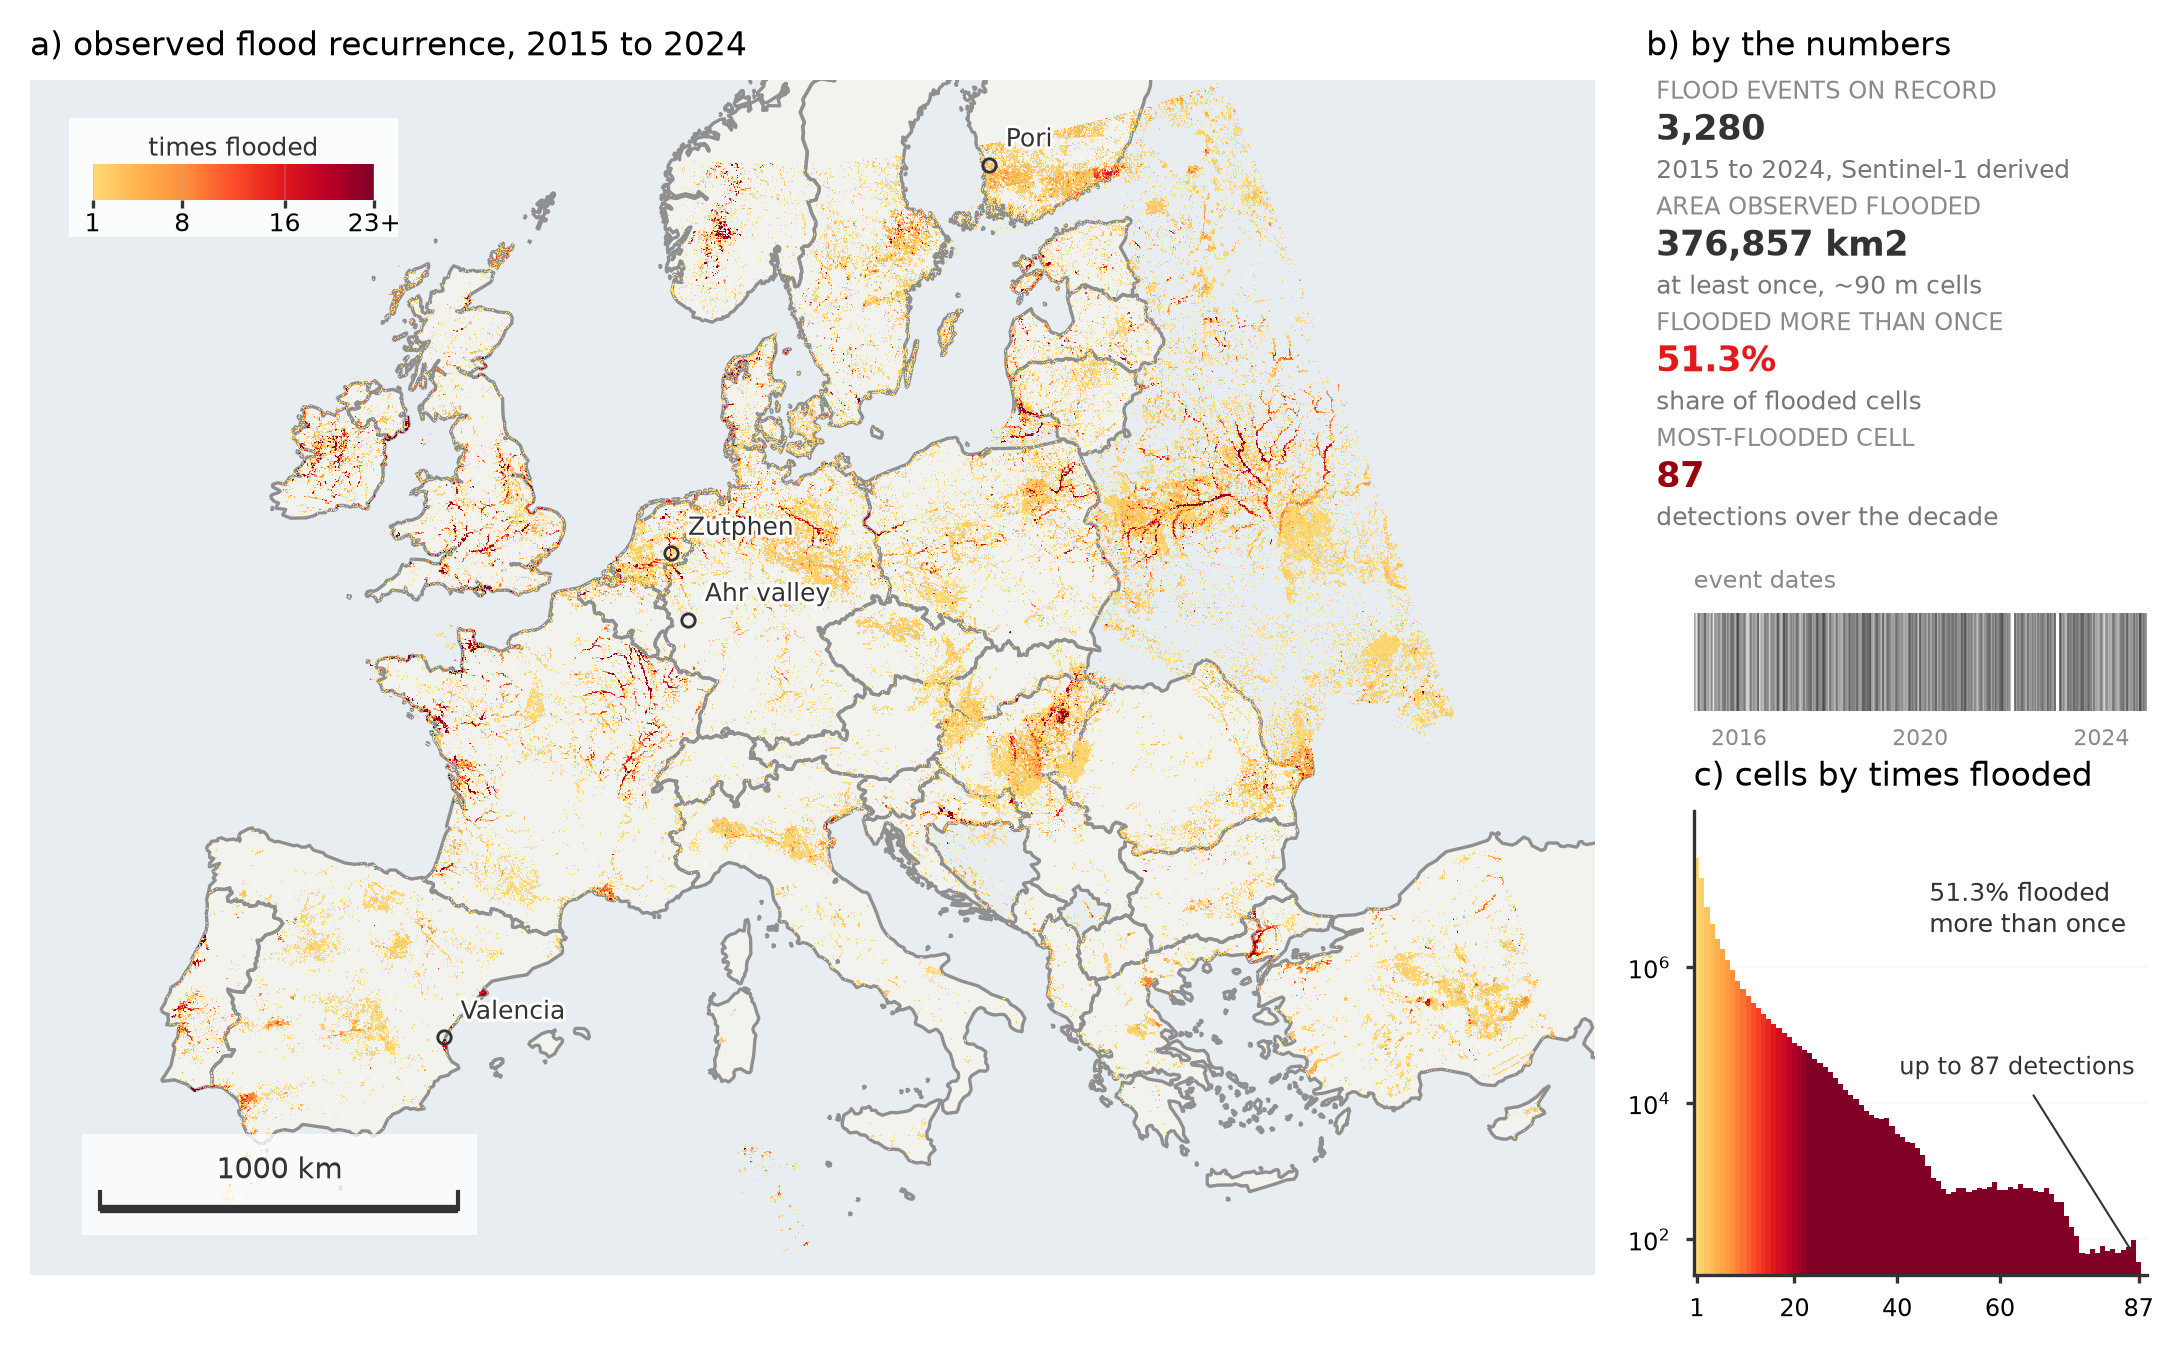
A decade of European flood recurrence
How often each place in Europe was detected flooded (2015–2025), from a single index query; the most repeatedly flooded cell is the Vouga/Aveiro floodplain in Portugal (89 times).
Reproducing these
These notebooks are reproduced from the paper and shown here with their committed
outputs: every euroflood call is real, and the final cell of each displays the
corresponding published figure for comparison. They are not executed in this
project's CI and are not runnable in place: some steps read external inputs (OSM
networks, HANZE impact records, GISCO NUTS boundaries).
The paper's figures, its derived data, and the analysis code that recreates them are
archived as a reproduction package on Zenodo. To re-run a notebook yourself, install
euroflood[viz] and supply those inputs under case_studies/data/:
Hackl, J. (2026). EuroFlood paper reproduction package: figures, derived data, and analysis code (Version v1.0.0) [Dataset]. Zenodo. https://doi.org/10.5281/zenodo.21510351
For a runnable, step-by-step introduction to the API, start with the tutorials instead.