EuroFlood
Query Europe's satellite flood-depth maps as GeoDataFrames, in a few lines.
The CEMS-EFAS archive is open but has no index: just a coordinate in each filename, which can sit 2,870 km from the flooding. EuroFlood discovers where and when floods happened across Europe from a published index (zero config), then downloads only the depth rasters you want, no ~39 GB bulk archive, no setup.


Install
Three lines
import euroflood as ef

cat = ef.floods("Zutphen, Netherlands")  # discover: a GeoDataFrame, one row per flood
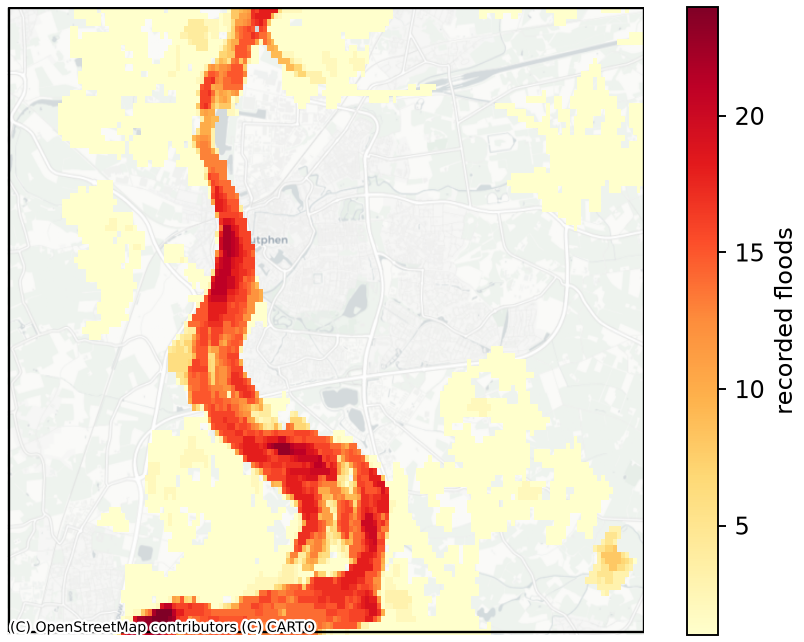
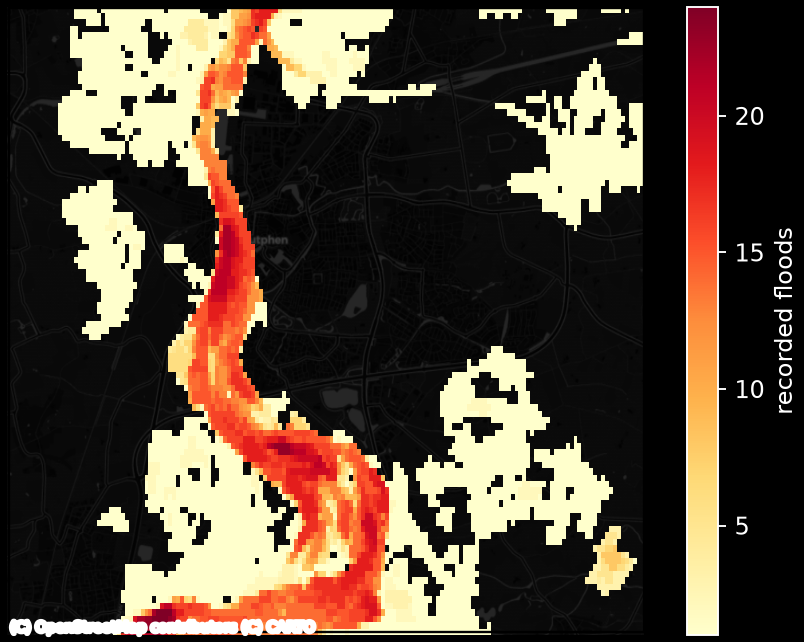
cat.plot()                                # visualize: recurrence heatmap, no download
cat.download().stats()                    # measure: fetch depth rasters + per-event stats
Zero configuration: the published index is read remotely and cached on first use.
See it across Europe
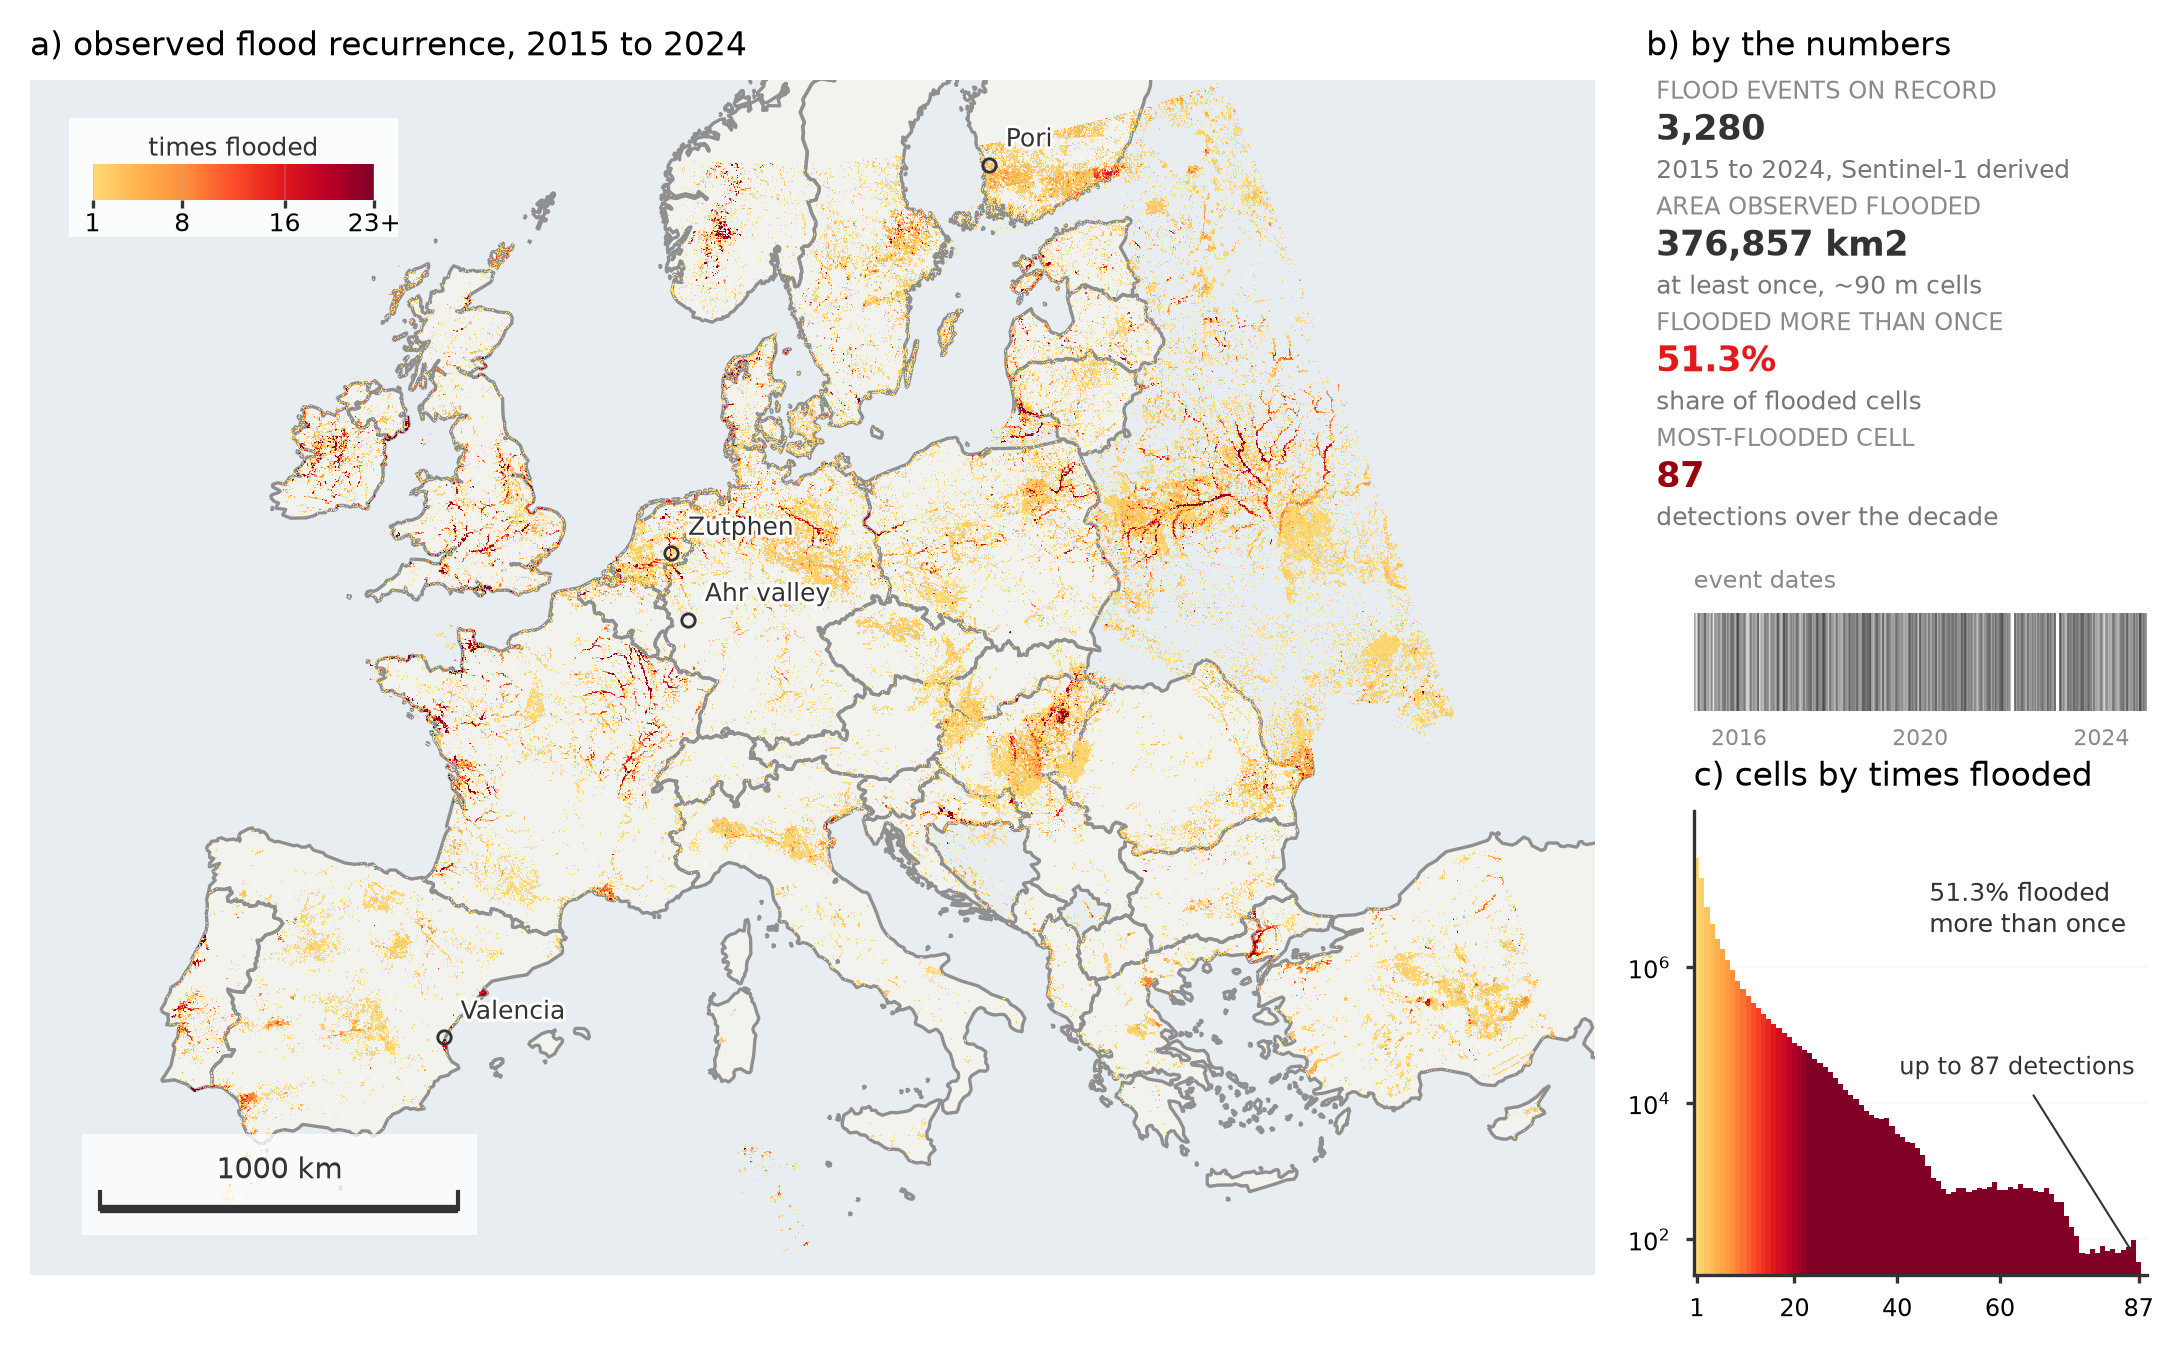
Every place the archive has seen flooded over 2015–2025: 412,138 km² in all, computed entirely from the index without downloading a single depth raster. Then zoom into any of it: the case studies work through real events, from Storm Boris to the Valencia DANA.
Why EuroFlood
-
One API, all of Europe
Continental coverage from ~3,610 Sentinel-1 flood-depth maps (2015–2025), indexed so a query streams a few MB, never the ~39 GB archive.
-
GeoDataFrames, not tiles
Every query returns a GeoPandas
GeoDataFrame: filter, clip, join, and export with the tools you already use. -
Visualize without downloading
Recurrence heatmaps, per-event footprints, and interactive Leaflet maps straight from the index, no rasters fetched.
-
Global hazard maps
The same API queries modelled CEMS-GLOFAS hazard depth for seven return periods (10–500 yr):
ef.hazard("Zutphen", return_period=100). -
CLI & offline
Every query is also a
eurofloodcommand; mirror the index once for fully offline / HPC use. -
Cited & reproducible
A versioned, checksummed index bundle with a manifest: pin a version, cite the source, reproduce a result.
Learn by doing
The tutorials take you from a first query to hazard maps and quantitative analysis: runnable notebooks that follow one place (Zutphen, on the IJssel) throughout. Then see the case studies for real-world analyses of genuine events across Europe.
EuroFlood code is MIT-licensed. The index and flood-depth maps derive from the JRC / Copernicus CEMS-EFAS dataset (CC-BY-4.0). See Citing EuroFlood for how to cite the software, the index, and the source data. Developed at Princeton University (Complex Infrastructure Systems Group).